09. リソースのモニタリング
Helmをインストールする
HelmはKubenetes用のパッケージマネージャーらしい。
Installing Helm | Helm
| $ curl -fsSL -o get_helm.sh https://raw.githubusercontent.com/helm/helm/main/scripts/get-helm-4
$ chmod 700 get_helm.sh
$ ./get_helm.sh
|
kube-prometheus-stackをインストールする
kube-prometheus-stackをインストールするとPrometheus(メトリクスの収集・保存)とGrafana(可視化・ダッシュボード)を使えるようになる。
GitHub - prometheus-community/helm-charts: Prometheus community Helm charts · GitHub
| $ helm repo add prometheus-community https://prometheus-community.github.io/helm-charts
$ helm repo update
$ helm install kube-prometheus-stack prometheus-community/kube-prometheus-stack \
--namespace monitoring \
--create-namespace
|
| $ kubectl get pods -n monitoring
NAME READY STATUS RESTARTS AGE
alertmanager-kube-prometheus-stack-alertmanager-0 2/2 Running 0 2m9s
kube-prometheus-stack-grafana-df7d5489d-fv5gx 3/3 Running 0 2m23s
kube-prometheus-stack-kube-state-metrics-69ff47cc6c-kcrhp 1/1 Running 0 2m23s
kube-prometheus-stack-operator-79dc5d8695-gkvqf 1/1 Running 0 2m23s
kube-prometheus-stack-prometheus-node-exporter-njf7c 1/1 Running 0 2m23s
prometheus-kube-prometheus-stack-prometheus-0 2/2 Running 0 2m8s
|
| $ kubectl port-forward -n monitoring svc/kube-prometheus-stack-grafana 3001:80
|
パスワードを確認する。
| $ kubectl get secret -n monitoring kube-prometheus-stack-grafana -o jsonpath="{.data.admin-password}" | base64 --decode
|
Webブラウザでhttp://localhost:3001を開きGrafanaにアクセスする。ユーザー名admin、上記のパスワードでログインする。
Podを監視する
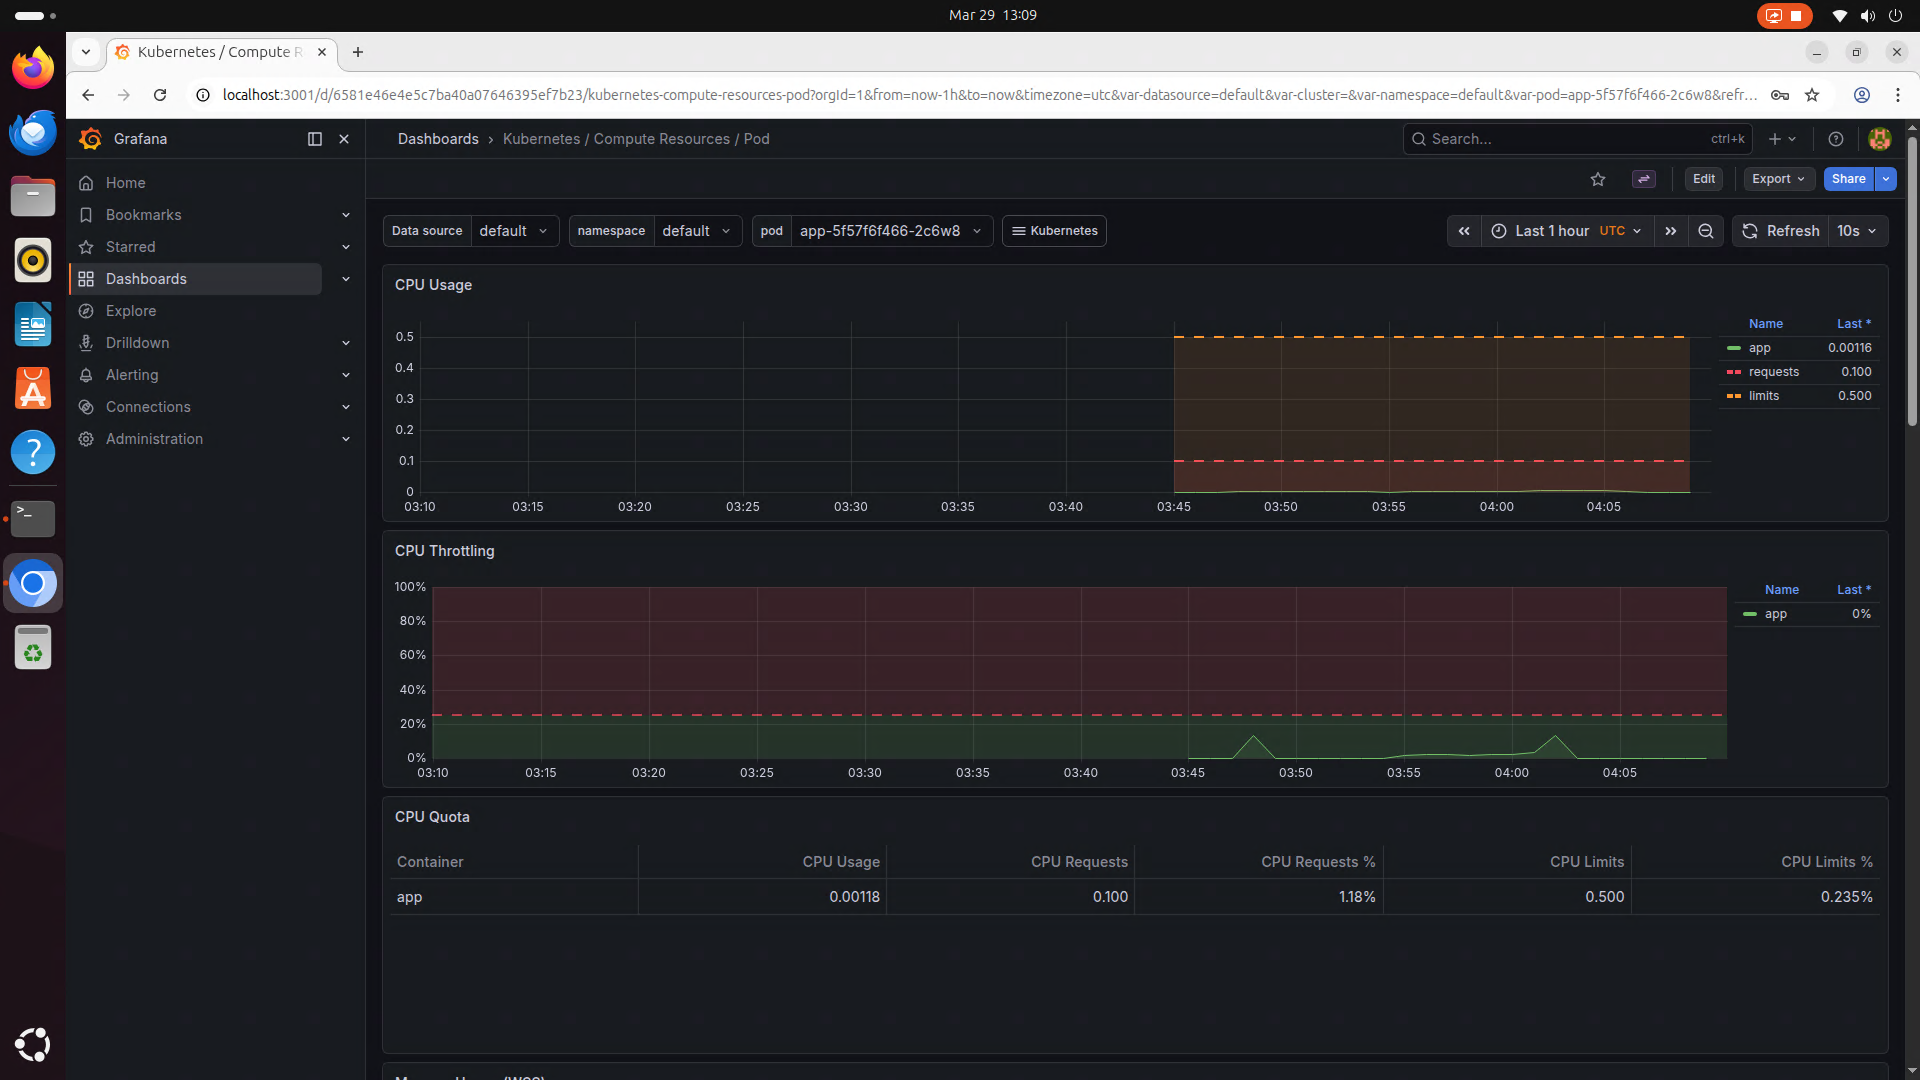
左のメニューにあるDashboardからKubernetes / Compute Resources / Podを選択することで、Podを確認できる。
このグラフを参考にDeploymentのYAMLを編集することでCPUリソースの割当精度を上げることができる。
| k8s/app-deployment.yaml |
|---|
1
2
3
4
5
6
7
8
9
10
11
12
13
14
15
16 | apiVersion: apps/v1
kind: Deployment
# 略
spec:
template:
spec:
containers:
- env:
ports:
- containerPort: 3000
protocol: TCP
resources: # CPUの使用量の下限・上限を指定する
requests:
cpu: "100m" # Pod1個で0.1コアを確保する
limits:
cpu: "500m" # Pod1個で最大0.5コアを確保する
|
mはミリコアという単位である。(例えば"100m"は100ミリコアで、"0.1"と等しい)
1コアはCPU使用率100%を示し、物理コア1つを100%使い切る。
Raspberry Pi 5は4コアなので、全コアを使い切ることは4コア(4000m)に相当する。
cpu: "4"とすると、Pod1つに4コア使い切ってしまうことになる。
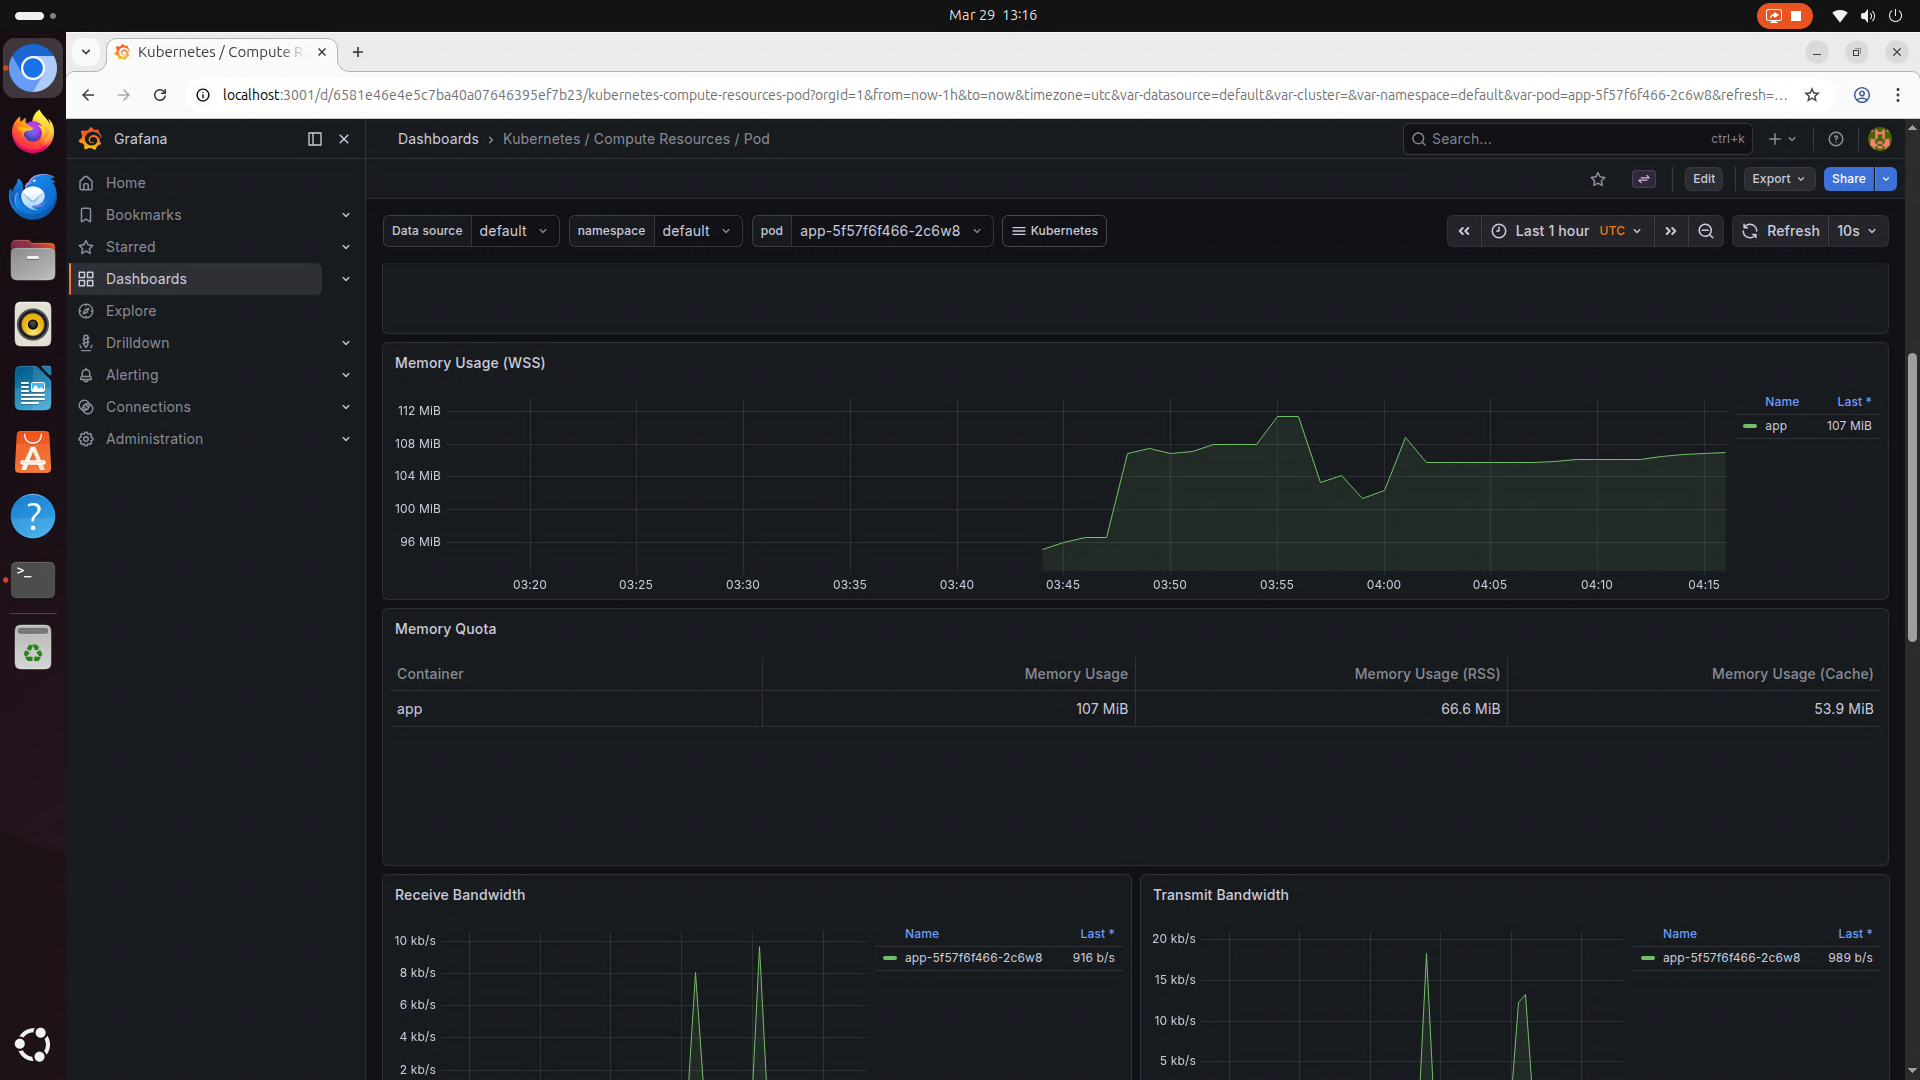
同様にメモリ使用率も確認できる。
| k8s/app-deployment.yaml |
|---|
1
2
3
4
5
6
7
8
9
10
11
12
13
14
15
16
17
18 | apiVersion: apps/v1
kind: Deployment
# 略
spec:
template:
spec:
containers:
- env:
ports:
- containerPort: 3000
protocol: TCP
resources: # CPUの使用量の下限・上限を指定する
requests:
cpu: "0.1" # Pod1個に確保するCPU使用率[コア]
memory: "128Mi" # Pod1個に確保するメモリ量[B]
limits:
cpu: "0.5" # Pod1個に確保する最大CPU使用率[コア]
memory: "256Mi" # Pod1個に確保する最大メモリ量[B]
|
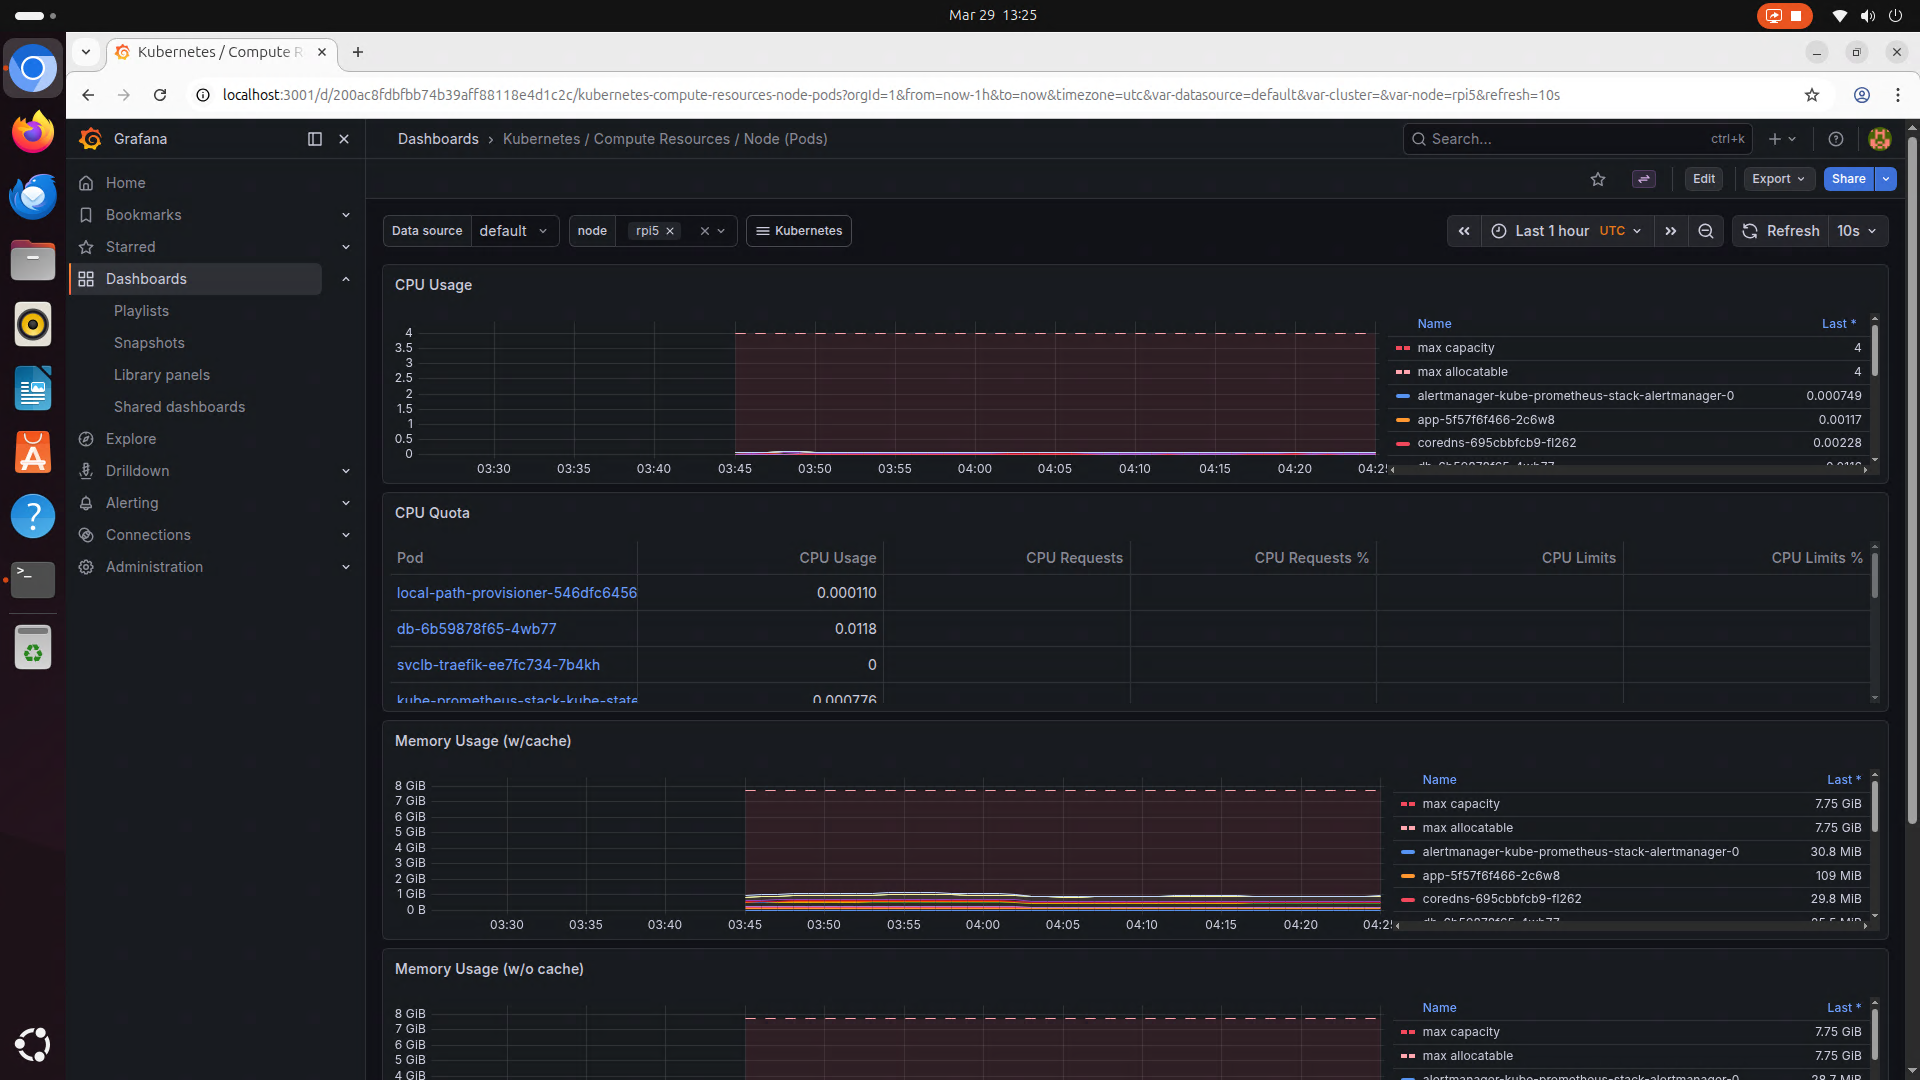
Kubernetes / Compute Resources / Node (Pods)からノード全体のリソース使用状況を確認できる。